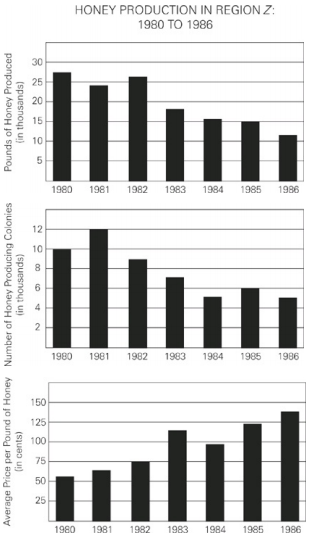
For what year depicted in the graphs was the percent decrease from the previous year of the number of honey producing colonies most similar to the average percent increase of the average price of a pound of honey for the six-year period?
-
Solution
1986
The question asks you to determine the overall average percent increase in the price per pound of honey and then compare that to each year’s annual percent decrease in the number of honey producing colonies to find the most similar, but opposite, number.To determine the average percent increase in the price of honey, find each year’s percent change using the percent change formula:
\(\frac{X_{present}-X_{past}}{X_{past}}\)
and then average those six numbers to get an average percent change of around 14%. For the other part of the problem, ignore the years in which number of colonies increases since the question asks for percent decrease from the previous year.Then find the percent change of the number of colonies for each remaining year. Using the same formula as above, from 1985 to 1986 the number of colonies decreases by about 14%. In fact, that is the only year in which the number decreases by less than 20%, so 1986 is the best answer.
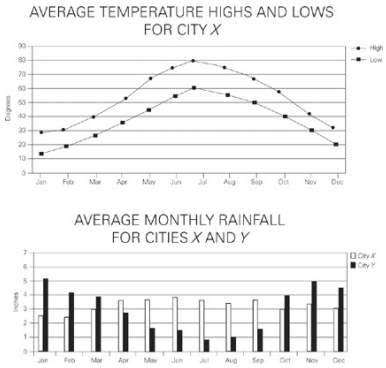
For which of the following months does the average monthly high temperature for City X fall within one standard deviation of the average annual high temperature?
Indicate all possible values.
-
Solution
B,C,E, and F
One standard deviation captures 68% of the data points, or 34% in each direction from the mean. For this question, that means that 68% of the months of the year will have average high temperatures within one standard deviation of the annual average high temperature. 12 × 68% = 8.16, so 8 months will be within one standard deviation. Standard deviation assumes a “normal” (balanced on the high and low ends) distribution, so the 2 months with the greatest average monthly high temperature and the 2 with the lowest average monthly high temperature will fall outside of one standard deviation.To answer the questions, use POE to eliminate the 2 most extreme months on each end. (Note that you don’t have to calculate anything to find the correct answers.) It is clear that January has the lowest average high temperature, so eliminate choice (A). February probably comes next, but it doesn’t matter since neither it nor December is an answer choice. November is definitely not one of the two months with the lowest average high temperatures, so choice (F) is in. July has the highest average high temperature, so eliminate choice (D). Whether June or August is second doesn’t matter for us because neither is an answer choice, but that means March, May, September, and November all make the cut.
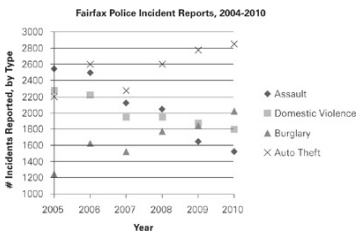
For how many of the years shown in the graph was the number of nonviolent crimes (burglary and auto theft) greater than the number of violent crimes (assault and domestic violence)?
-
Solution
Before you add the number of violent and nonviolent crimes for each year, look at the chart to see if any of the years are so obvious that you don’t have to do the calculation. For 2009 and 2010, nonviolent crimes are clearly greater; for 2005, violent crimes are clearly greater. In 2006, there were about 4,700 violent crimes and 4,200 nonviolent crimes. In 2007, there were about 4,100 violent crimes and 3,800 nonviolent crimes. And in 2008, there were about 4,400 nonviolent crimes and 4,000 violent crimes. So for each of he years 2008, 2009, and 2010, there were more nonviolent than violent crimes.The correct answer is choice (D).
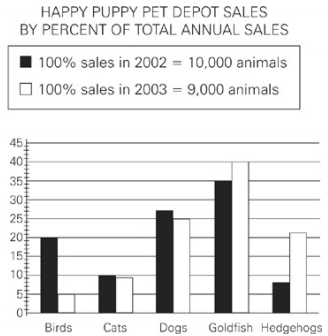
If Happy Puppy Pet Depot saw the same percentage increase in total number of animals sold from 2003 to 2004 as it did from 2002 to 2003, how many animals, to the nearest integer, did the store sell in 2004?
-
Solution
11,111 The key here is recognizing that the same percentage increase does not equal the same total increase of items.To find the percentage increase from 2002 to 2003, use the percentage change formula:
\(\frac{X_{present}-X_{past}}{X_{past}}\)
Plugging in 10,000 for Xpresent and 9,000 for Xpast , you find an 11.1111% increase for 2002 to 2003. Since the problem said the percent increase was the same,find the increase in number of animals sold from 2003 to 2004: 11.1111% × 10,000 = 1111.11 more animals in 2004. Adding that to the number sold in 2003 (10,000) yields 11,111.11 in 2004, which rounded to the nearest integer is 11,111.
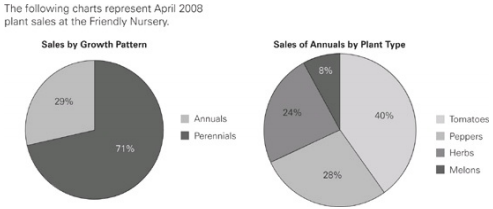
In April 2008 there were four varieties of tomatoes available at Friendly Nursery: Red Giants, Mortgage Lifters, Beefsteaks and Sun Golds. If 1000 plants were sold, which of the following could be the number of Beefsteak tomato plants sold?
Indicate all possible values.
-
Solution
A,B, and C
1,000 plants were sold, and from the first graph, you know that 71% of them, or 710, were annuals. Looking at the second graph, 40% of the 710 annuals, or 284, were tomatoes. Of those, any, all or none could have been Beefsteaks—you don’t know anything about that. So any number between 0 and 284 will work, making choices (A), (B), and (C) the correct answer.

Which of the following is most nearly the percent of plants sold at Friendly Nursery in April 2008 that were herbs?
-
Solution
The fastest way to answer this question is to assign numerical values to the percentages given in the graphs.You can choose any numbers to work with and get the same answer, but since the graphs give percentages, choosing 100 total plants sold will make things easy. If total plants sold were 100, 71 were annuals. Of those 71 annuals, the second graph says that 24% were herbs. 24% × 71 = 17.04. Since you started with 100 total plants, 17.04/100 = 17.04%.Choice (D) is nearest 17.04%, so it is the best answer.
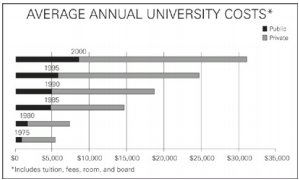
The average annual cost to attend a private university increased at a constant rate from 1995 to 2000, and 2.5 million students attended private universities in 1998. If 2 million students attended private universities in 1990, then by approximately what percent did the total dollar amount spent on private universities increase from 1990 to 1998?
-
Solution
The average cost of a private university in 1995 was $17,000, and the cost in 2000 was $22,000, as you discovered in the previous question.The increase over the 5-year period was $5,000. If the average cost increased at a constant rate, then the increase was $1,000 per year.The 3-year increase from 1995 to 1998 was therefore $3,000, putting the average cost for a private university at $20,000 in 1998.To find the total cost for that year, multiply the average cost per student times the number of students: ($20,000)(2.5 million) = $50 billion. Similarly, in 1990, the total dollar amount spent on private universities was ($13,000)(2 million) = $26 billion.The billions cancel out of the percent change formula, giving you \(\frac{24}{26}\) × 100 ≈ 92%, which is the closest to choice (E).
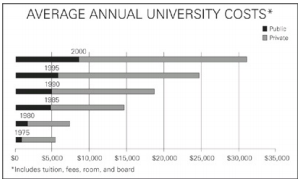
By approximately what percent did the average annual cost to attend a private university increase from 1980 to 2000?
-
Solution
The cost increases from about $6,000 to $22,000. Use the percent change formula to find the percent increase:\(\frac{16,000}{6,000}\) × 100 = 267%, so the answer is choice (D).

In 2005, the ratio of the average annual cost to attend a private university to the average annual cost to attend a public university was the same as it was in 1990. If the average annual cost to attend a public university in 2005 was $11,000, what was the average annual cost to attend private university in that year, to the nearest $1,000?
-
Solution
The private : public ratio in 1990 was about \(\frac{13}{5}\). Setting the ratios equal for the two years (setting up a proportion) gives you:\(\frac{13}{5}=\frac{x}{11,000}\).The private cost is approximately $29,000, so the answer is choice (C).
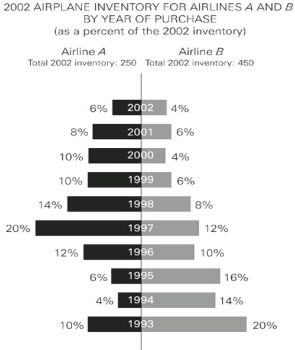
Which of the following can be inferred from the graph?
Indicate all possible values.
-
Solution
Although Airline A has fewer airplanes than does Airline B, you have no information about each airline’s customers; choice (A) is incorrect. While the percent of airplanes purchased by Airline B is twice as large as that purchased by Airline A, the actual number of airplanes purchased by Airline B is approximately four times as large as those for Airline A, not twice as large. So, choice (B) is incorrect.To evaluate choice (C), you need to add the percents in each column year by year until you get to 50%.The airplane with the median age for Airline A was purchased in 1997. For Airline B, the median is between 1995 and 1996, making the median age for the airplanes in Airline B’s inventory older.This validates choice (C), the only correct answer.