You should spend about 20 minutes on this task.
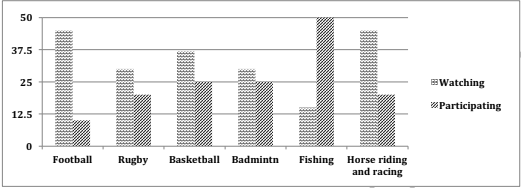
The column graph shows the percentage of males in a particular country who prefer watching sports to males who prefer participating in sports. Summarise the information by selecting and reporting the main features and make comparisons where relevant.
Write at least 150 words.

Model Answer
The given column graph compares the ratio of males who prefer watching sports events and that of those who would rather take part in sports activities. It can be seen that fishing is the only sport, which has more participants than spectators.
As shown in the graph, a large percentage of males (40%) in that particular country enjoy watching football and horse riding and racing. Approximately 36% like to watch basketball. Surprisingly, an equal proportion of males treat rugby and badminton as their favourite sports for watching, accounting for roughly 27%.
In terms of the people who choose to participate in sports instead of watching, 50% of them take fishing as their first choice. However, 25% of males choose to take part in basketball and badminton, while football is the last sports they would like to try.
To sum up, fishing is the most popular sports event in which males in this specific nation would like to take part, while it is the last event they would choose to watch.