You should spend about 20 minutes on this task.
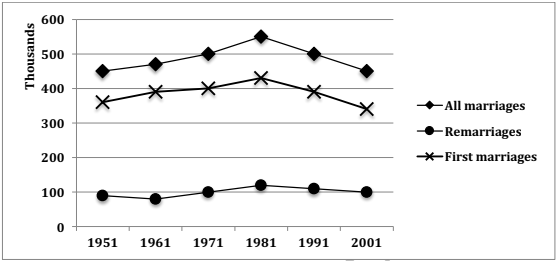
The diagram below shows the number of marriages in the UK between 1951 and 2001. The data given is for all marriages, remarriages (any partner) and first marriages. Summarise the information by selecting and reporting the main features and make comparisons where relevant.
Write at least 150 words.

Model Answer
The given line graph illustrates data about the number of first marriages, remarriages (either partner) and the total number of marriages from 1950 to 2001. It is manifest from the graph that the number of remarriages was far lower than that of first marriages and hovered around the 100,000 mark throughout the given period of time.
Approximately 350,000 first marriages were solemnized in 1951. This number grew gradually and reached a peak of 430,000 marriages in 1981, after which it fell moderately and again reached 350,000 mark by 2001.
The total number of marriages showed a similar trend to the number of first marriages, as it was just the sum total of first marriages and remarriages. As the number of remarriages fluctuated between 90,000 and 120,000 between the years of 1951 and 2001, the line depicting the total number of marriages was almost parallel to that portraying the first marriages.
Overall, it is clear that the year 1981 witnessed the maximum number of marriages and remarriages.