You should spend about 20 minutes on this task.
The chart below shows the resources used to make 1000 disposable cups in different materials: polystyrene and paper. Summarize the information by selecting and reporting the main features and make comparisons where relevant.

Model Answer
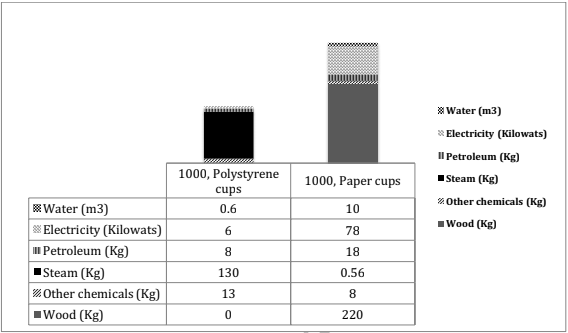
The stacked bar graph shows the amount of different elements required for making 1000 polystyrene and paper cups. It is clear that overall lesser energy is needed in making 1000, polystyrene cups than on making 1000 paper cups.
The production of 1000 polystyrene cups needs 8 kg of petroleum and 13 kg of other chemicals. Steam is required in a large quantity, which is 10 times as much as of other chemicals. This process is rather energy-saving, only costing 0.6 m3 of water and 6 kilowats of electricity.
However, in the process of making paper cups, the consumption of water and electricity is far more (10m3 and 78 kilowats respectively) than that in polystyrene cups. It also requires more petroleum, which constitutes 18 kg. Steam is also required in negligible amount as compared to that needed in polystyrene cups. Amount of the chemicals is also needed lesser than that in polystyrene cups.
Overall, the production of polystyrene cups is environmentally friendly, because it costs less energy and doesn’t need any wood while 1000 paper cups almost needs 220 kilogram of wood.
(Note: Stacked bar graph is a graph that is used to compare the parts to the whole. The bars in a stacked bar graph are divided into categories. Each bar represents a total.)