You should spend about 20 minutes on this task.
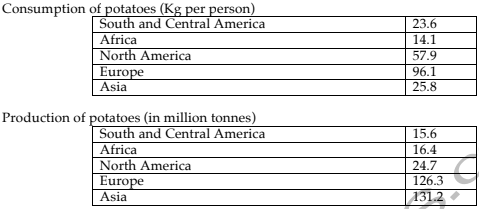
The tables below show the consumption and production of potatoes in different regions of the world in 2006. Summarise the information by selecting and reporting the main points and make comparisons where relevant.
Write at least 150 words.

Model Answer
The given tables compare the yield of potatoes in million tonnes with the consumption in Kg per person in 2006 in five regions of the world, which are South and Central America, Africa, North America, Europe and Asia, in 2006. It is clear that except for the Americas, the production of potatoes outstripped the consumption in all other areas.
The production of potatoes was the highest in Europe and Asia at around 130 million tonnes each. The production in all the other regions was between 15 and 25 million tonnes. However, as far as the consumption is concerned, the Europeans seemed to be the most fond of potatoes, eating about 96 kg per person. North Americans took the second place in the consumption at just below 60 kg per person. People of South and Central America and Asia ate around 25 kg per person, but the Africans were the least fond of potatoes, consuming approximately 14 kg per person in 2006.
Overall, in North America, the production was less than half the consumption, whereas in Asia the production was six times more than the consumption.