You should spend about 20 minutes on this task.
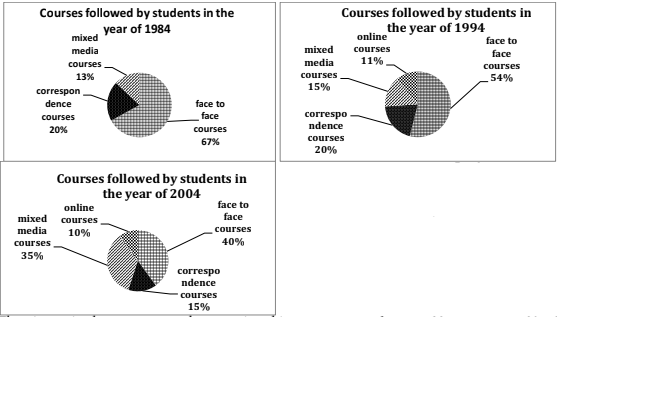
The pie charts below show the different types of courses, which were followed by the students during the years of 1984, 1994 and 2004. Summarize the information by selecting and reporting the main features, and make comparisons where relevant.
Write at least 150 words.

Model Answer
The given pie charts compare the ways in which students studied in 1984, 1994 and 2004. It is clear that some methods gained popularity while others lost popularity.
In 1984, face-to-face courses were most popular with two thirds (67%) of the students opting for such courses. A fifth (20%) of the students studied through correspondence courses and the least number (13%) opted for mixed media courses.
In 1994, the popularity of correspondence courses did not change. Mixed media courses gained slight popularity with 2% more students opting for them. Face to face method decreased by 13% and in their place online courses were opted by 11% students.
In 2004, the popularity of mixed media courses more than doubled and 35% students enrolled in such courses. Face to face courses reduced further and 40% students chose such courses in 2004.
Overall, it can be seen that with the passage of time fewer students chose face-to-face method, but the multimedia courses were chosen by more and more students.