You should spend about 20 minutes on this task.
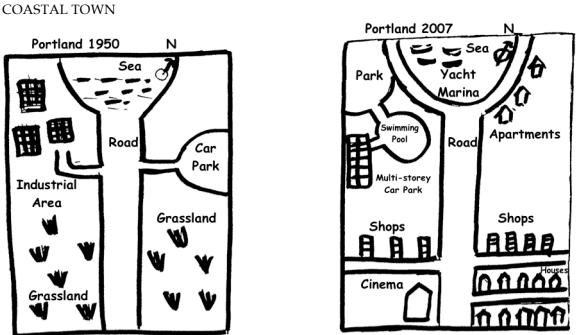
The diagram below shows the changes, which took place in a coastal area called Pentland from 1950 to 2007. Write a report for a university lecturer describing the diagrams below.
Write at least 150 words.

Model Answer
The given diagram shows the changes, which occurred in a coastal town, Pentland, between 1950 and 2007. It can be seen that the area developed a lot in the given period of 57 years.
In 1950, Pentland was located towards the south of the sea. There was a straight main road bisecting the town into two. Two side roads were there, one to the left and the other to the right. The left road led to an industrial area, whereas the right one led to the car park. The rest of the area was mainly grassland.
57 years later, the sea was developed as a Yacht Marina, circled by a newly built road, which was linked to the original straight road. Many apartments were built to the right. The industrial area on the left, was replaced by a park, a swimming pool and a multi-storey car park. The side roads were shifted further southwards. The car park on the right was removed and many apartments were built in its place. On the south east corner of Pentland, many houses were built and a cinema was constructed in the corner between the main road and the left side road. Many shops were opened along the northern side of both side roads.
Overall, Pentland developed into a busy commercial coastal town over a period of half century.