You should spend about 20 minutes on this task.
The chart below shows the number of four different species of fish between 1982 and 2007. Summarise the information by selecting and reporting the main features, and make comparisons where relevant.
Write at least 150 words.

Model Answer
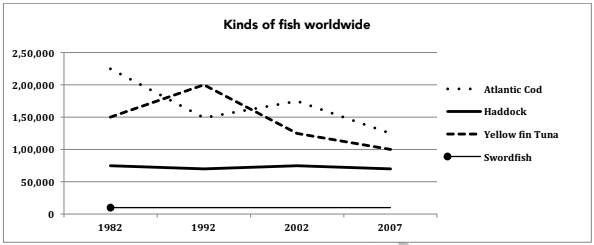
The given line graph compares the number of four species of fish, namely Atlantic Cod, Yellow-fin Tuna, Haddock and the Swordfish from 1982 to 2007. A cursory glance at the table is enough to make it clear that the Atlantic Cod dominated in numbers, except for the year 1992, when the Yellow-fin Tuna was the maximum in number among the given four species.
In 1982, there were 225,000 Atlantic Cod, but after that their numbers dropped dramatically, and reached approximately 150,000 by 1992. After 1992, however, the numbers picked up again and reached 175,000 by 2002. From 2002 to 2007, the Atlantic cod decreased in numbers and reached a figure of nearly 125,000. The Yellow-fin Tuna showed an opposing trend to Atlantic cod till 2002, but after that their numbers fell and reached 100,000.
The swordfish were in minority and their numbers were around 10,000 during the entire 25- year period. The Haddock were stable at around 75,000 in numbers throughout the given period.
Overall, the number of Atlantic cod and Yellow-fin tuna declined over the period with some fluctuations, but the other two species were more or less unchanged.