You should spend about 20 minutes on this task.
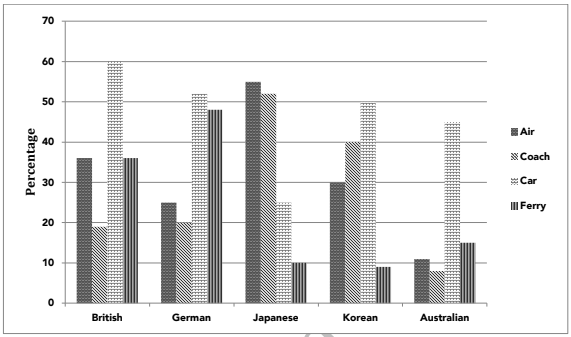
The graph below shows the types of transport used by tourists who visited New Zealand from five countries in 2004. Summarise the information by selecting and reporting the main features and make comparisons where relevant.
Write at least 150 words.

Model Answer
The given column graph illustrates the percentage of tourists from Britain, Germany, Japan, Korea and Australia who used different modes of transport, such as air, coach, car or ferry when they visited New Zealand in 2004. A quick glance at the graph is enough to make it clear that the Japanese preferred air travel the most, where as the other given countries used car the most.
60% British tourists and approximately 52, 50 and 45% German, Korean and Australian tourists used the car to visit various places in New Zealand. The least percentage of the Japanese tourists (25%) used the car to travel around New Zealand. The tourists from Japan were the most fond of air travel. Roughly 55% Japanese tourists used air transport to travel within New Zealand. Air transport was used by 35% British, 30% Korean and 25% German tourists. By contrast only 11% Australians used air transport. A similar percentage (20%) British and German tourists used the coach, whereas the percentage of Koreans using the coach was almost double (40%) than that of the British and Germans. Coach was used the most (52%) by the Japanese tourists, whereas the least Australian tourists (8%) used the coach. Nearly 48% German tourists and 35% British tourists used the ferry. The tourists from japan, Korea and Australia were less than 15% in each case, who used the ferry as a means of transport.
Overall, coach was the least preferred mode of transport among the British, German and Australian tourist, whereas the ferry was used the least by the Japanese and Koreans.