Which of the following equations relates y to x for the values in the table above?
-
Solution
According to the table, the value of y increases by \(\frac{14}{4}=\frac{7}{2}\) every time the value of x increases by 1. It follows that the simplest equation relating y to x is linear and of the form y = 7⁄2x + b for some constant b. Furthermore, the ordered pair \(\left ( 1,\frac{11}{4} \right )\) from the table must satisfy this equation. Substituting 1 for x and \(\frac{11}{4}\) for y in the equation y = 7⁄2x + b gives \(\frac{11}{4}=\frac{7}{2}(1)+b\). Solving this equation for b gives b = -3⁄4. Therefore, the equation in choice D correctly relates y to x.
Choices A and B are incorrect. The relationship between x and y cannot be exponential because the differences, not the ratios, of y-values are the same every time the x-values change by the same amount. Choice C is incorrect because the ordered pair \(\left ( 2,\frac{25}{4} \right )\) is not a solution to the equation y = 3⁄4x + 2. Substituting 2 for x and \(\frac{25}{4}\) for y in this equation gives \(\frac{25}{4}=\frac{3}{2}+2\), which is false.
refer to the following information.

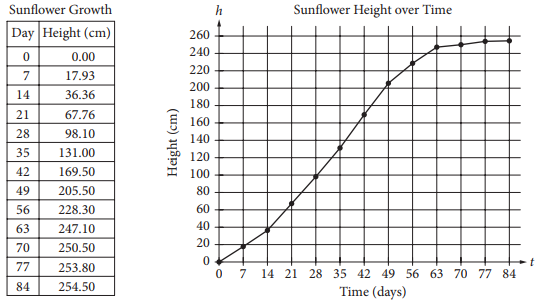
In 1919, H. S. Reed and R. H. Holland published a paper on the growth of sunflowers. Included in the paper were the table and graph above, which show the height h, in centimeters, of a sunflower t days after the sunflower begins to grow.
The growth rate of the sunflower from day 14 to day 35 is nearly constant. On this interval, which of the following equations best models the height h, in centimeters, of the sunflower t days after it begins to grow?
-
Solution
According to the table, the height of the sunflower is 36.36 cm on day 14 and 131.00 cm on day 35. Since the height of the sunflower between day 14 and day 35 changes at a nearly constant rate, the height of the sunflower increases by approximately \(\frac{131.00-36.36}{35-14}\approx 4.5\) cm per day. Therefore, the equation that models the height of the sunflower t days after it begins to grow is of the form h = 4.5t + b. Any ordered pair (t, h) from the table between day 14 and day 35 can be used to estimate the value of b. For example, substituting the ordered pair (14, 36.36) for (t, h) into the equation h = 4.5t + b gives 36.36 = 4.5(14) + b. Solving this for b yields b = −26.64. Therefore, of the given choices, the equation h = 4.5t − 27 best models the height h, in centimeters, of the sunflower t days after it begins to grow.
Choices A, C, and D are incorrect because the growth rates of the sunflower from day 14 to day 35 in these choices are significantly higher or lower than the true growth rate of the sunflower as shown in the graph or the table. These choices may result from considering time periods different from the period indicated in the question or from calculation errors.
refer to the following information.

In 1919, H. S. Reed and R. H. Holland published a paper on the growth of sunflowers. Included in the paper were the table and graph above, which show the height h, in centimeters, of a sunflower t days after the sunflower begins to grow.
The function h, defined by h(t) = at + b , where a and b are constants, models the height, in centimeters, of the sunflower after t days of growth during a time period in which the growth is approximately linear. What does a represent?
-
Solution
Based on the definition and contextual interpretation of the function h, when the value of t increases by 1, the height of the sunflower increases by a centimeters. Therefore, a represents the predicted amount, in centimeters, by which the sunflower grows each day during the period the function models.
Choice B is incorrect. In the given model, the beginning of the period corresponds to t = 0, and since h(0) = b, the predicted height, in centimeters, of the sunflower at the beginning of the period is represented by b, not by a. Choice C is incorrect. If the period of time modeled by the function is c days long, then the predicted height, in centimeters, of the sunflower at the end of the period is represented by ac + b, not by a. Choice D is incorrect. If the period of time modeled by the function is c days long, the predicted total increase in the height of the sunflower, in centimeters, during that period is represented by the difference h(c) − h(0) = (ac + b) − (a · 0 + b), which is equivalent to ac, not a.
refer to the following information.

In 1919, H. S. Reed and R. H. Holland published a paper on the growth of sunflowers. Included in the paper were the table and graph above, which show the height h, in centimeters, of a sunflower t days after the sunflower begins to grow.
Over which of the following time periods is the average growth rate of the sunflower least?
-
Solution
The average growth rate of the sunflower over a certain time period is the increase in height of the sunflower over the period divided by the time. Symbolically, this rate is \(\frac{h(b)-h(a)}{b-a}\), where a and b are the first and the last day of the time period, respectively. Since the time period for each option is the same (21 days), the total growth over the period can be used to evaluate in which time period the sunflower grew the least. According to the graph, the sunflower grew the least over the period from day 63 to day 84. Therefore, the sunflower’s average growth rate was the least from day 63 to day 84.
Alternate approach: The average growth rate of the sunflower over a certain time period is the slope of the line segment that joins the point on the graph at the beginning of the time period with the point on the graph at the end of the time period. Based on the graph, of the four time periods, the slope of the line segment is least between the sunflower’s height on day 63 and its height on day 84.
Choices A, B, and C are incorrect. On the graph, the line segment from day 63 to 84 is less steep than each of the three other line segments representing other periods. Therefore, the average growth rate of the sunflower is the least from day 63 to 84.
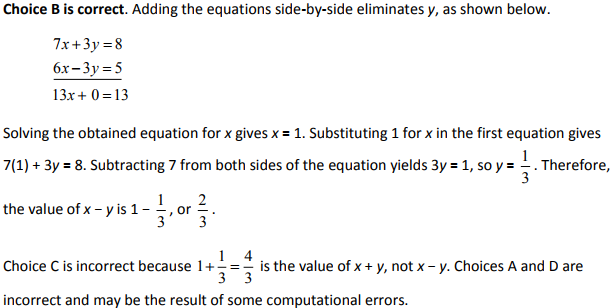
7x + 3y =8
6x − 3y =5
For the solution (x,y) to the system of equations above, what is the value of x – y?
-
Solution

Between 1497 and 1500, Amerigo Vespucci embarked on two voyages to the New World. According to Vespucci’s letters, the first voyage lasted 43 days longer than the second voyage, and the two voyages combined lasted a total of 1,003 days. How many days did the second voyage last?
-
Solution
Let x represent the number of days the second voyage lasted. The number of days the first voyage lasted is then x + 43. Since the two voyages combined lasted a total of 1,003 days, the equation x + (x + 43) = 1,003 must hold. Combining like terms yields 2x + 43 = 1,003, and solving for x gives x = 480.
Choice A is incorrect because 460 + (460 + 43) = 963, not 1,003 days. Choice C is incorrect because 520 + (520 + 43) = 1,083, not 1,003 days. Choice D is incorrect because 540 + (540 + 43) = 1,123, not 1,003 days.
The total area of a coastal city is 92.1 square miles, of which 11.3 square miles is water. If the city had a population of 621,000 people in the year 2010, which of the following is closest to the population density, in people per square mile of land area, of the city at that time?
-
Solution
The land area of the coastal city can be found by subtracting the area of the water from the total area of the coastal city; that is, 92.1 − 11.3 = 80.8 square miles. The population density is the population divided by the land area, or \(\frac{621,000}{80.8}=7,685\), which is closest to 7,690 people per square mile.
Choice A is incorrect and may be the result of dividing the population by the total area, instead of the land area. Choice C is incorrect and may be the result of dividing the population by the area of water. Choice D is incorrect and may be the result of making a computational error with the decimal place.
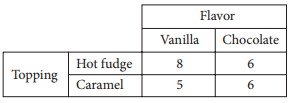
Ice Cream and Topping Selections

The table above shows the flavors of ice cream and the toppings chosen by the people at a party. Each person chose one flavor of ice cream and one topping. Of the people who chose vanilla ice cream, what fraction chose hot fudge as a topping?
-
Solution
According to the table, 13 people chose vanilla ice cream. Of those people,8 chose hot fudge as a topping. Therefore, of the people who chose vanilla ice cream, the fraction who chose hot fudge as a topping is \(\frac{8}{13}\).
Choice A is incorrect because it represents the fraction of people at the party who chose hot fudge as a topping. Choice B is incorrect because it represents the fraction of people who chose vanilla ice cream with caramel as a topping. Choice C is incorrect because it represents the fraction of people at the party who chose vanilla ice cream.
The members of a city council wanted to assess the opinions of all city residents about converting an open field into a dog park. The council surveyed a sample of 500 city residents who own dogs. The survey showed that the majority of those sampled were in favor of the dog park. Which of the following is true about the city council’s survey?
-
Solution
The members of the city council wanted to assess opinions of all city residents. To gather an unbiased sample, the council should have used a random sampling design to select subjects from all city residents. The given survey introduced a sampling bias because the 500 city residents surveyed were all dog owners. This sample is not representative of all city residents.
Choice A is incorrect because when the sampling method isn’t random, there is no guarantee that the survey results will be reliable; hence, they cannot be generalized to the entire population. Choice B is incorrect because a larger sample size would not correct the sampling bias. Choice C is incorrect because a survey sample of non–dog owners would likely have a biased opinion, just as a sample of dog owners would likely have a biased opinion.

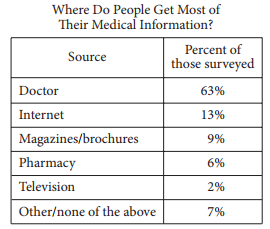
The table above shows a summary of 1,200 responses to a survey question. Based on the table, how many of those surveyed get most of their medical information from either a doctor or the Internet?
-
Solution
According to the table, 63% of survey respondents get most of their medical information from a doctor and 13% get most of their medical information from the Internet. Therefore, 76% of the 1,200 survey respondents get their information from either a doctor or the Internet, and 76% of 1,200 is 912.
Choices A, B, and D are incorrect. According to the table, 76% of survey respondents get their information from either a doctor or the Internet. Choice A is incorrect because 865 is about 72% (the percent of survey respondents who get most of their medical information from a doctor or from magazines/brochures), not 76%, of 1,200. Choice B is incorrect because 887 is about 74%, not 76%, of 1,200. Choice D is incorrect because 926 is about 77%, not 76%, of 1,200.
