refer to the following information.
\(I=\frac{P}{4\pi r^{2}}\)At a large distance r from a radio antenna, the intensity of the radio signal I is related to the power of the signal P by the formula above.
For the same signal emitted by a radio antenna, Observer A measures its intensity to be 16 times the intensity measured by Observer B. The distance of Observer A from the radio antenna is what fraction of the distance of Observer B from the radio antenna?
-
Solution

refer to the following information.
\(I=\frac{P}{4\pi r^{2}}\)At a large distance r from a radio antenna, the intensity of the radio signal I is related to the power of the signal P by the formula above.
Which of the following expresses the square of the distance from the radio antenna in terms of the intensity of the radio signal and the power of the signal?
-
Solution
To rearrange the formula I =\(\frac{P}{4\pi r^{2}}\) in terms of r2, first multiply each side of the equation by r2. This yields r2I =\(\frac{P}{4\pi}\). Then dividing each side of r2I = \(\frac{P}{4\pi}\) by I gives r2 = \(\frac{P}{4\pi I}\).
Choices A, C, and D are incorrect and may result from algebraic errors during the rearrangement of the formula.
A project manager estimates that a project will take x hours to complete, where x > 100. The goal is for the estimate to be within 10 hours of the time it will actually take to complete the project. If the manager meets the goal and it takes y hours to complete the project, which of the following inequalities represents the relationship between the estimated time and the actual completion time?
-
Solution
The difference between the number of hours the project takes, y, and the number of hours the project was estimated to take, x, is |y − x|. If the goal is met, the difference is less than 10, which can be represented as |y − x| < 10 or −10 < y − x < 10. Choice A is incorrect. This inequality states that the estimated number of hours plus the actual number of hours is less than 10, which cannot be true because the estimate is greater than 100. Choice B is incorrect. This inequality states that the actual number of hours is greater than the estimated number of hours plus 10, which could be true only if the goal of being within 10 hours of the estimate were not met. Choice C is incorrect. This inequality states that the actual number of hours is less than the estimated number of hours minus 10, which could be true only if the goal of being within 10 hours of the estimate were not met.
refer to the following information.
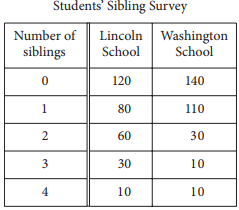
A sociologist chose 300 students at random from each of two schools and asked each student how many siblings he or she has. The results are shown in the table below.

There are a total of 2,400 students at Lincoln School and 3,300 students at Washington School.
Based on the survey data, which of the following most accurately compares the expected total number of students with 4 siblings at the two schools?
-
Solution
When survey participants are selected at random from a larger population, the sample statistics calculated from the survey can be generalized to the larger population. Since 10 of 300 students surveyed at Lincoln School have 4 siblings, one can estimate that this same ratio holds for all 2,400 students at Lincoln School. Also, since 10 of 300 students surveyed at Washington School have 4 siblings, one can estimate that this same ratio holds for all 3,300 students at Washington School. Therefore, approximately \(\frac{10}{30}\) × 2,400 = 80 students at Lincoln School and \(\frac{10}{30}\)× 3,300 = 110 students at Washington School are expected to have 4 siblings. Thus, the total number of students with 4 siblings at Washington School is expected to be 110 − 80 = 30 more than the total number of students with 4 siblings at Lincoln School.
Choices A, B, and D are incorrect and may result from either conceptual or calculation errors. For example, choice A is incorrect; even though there is the same ratio of survey participants from Lincoln School and Washington School with 4 siblings, the two schools have a different total number of students, and thus, a different expected total number of students with 4 siblings.
refer to the following information.
A sociologist chose 300 students at random from each of two schools and asked each student how many siblings he or she has. The results are shown in the table below.

There are a total of 2,400 students at Lincoln School and 3,300 students at Washington School.
What is the median number of siblings for all the students surveyed?
-
Solution
The median of a data set is the middle value when the data points are sorted in either ascending or descending order. There are a total of 600 data points provided, so the median will be the average of the 300th and 301st data points. When the data points are sorted in order:
⇒ Values 1 through 260 will be 0.
⇒ Values 261 through 450 will be 1.
⇒ Values 451 through 540 will be 2.
⇒ Values 541 through 580 will be 3.
⇒ Values 581 through 600 will be 4.
Therefore, both the 300th and 301st values are 1, and hence the median is 1.
Choices A, C, and D are incorrect and may result from either a calculation error or a conceptual error.
A survey was taken of the value of homes in a county, and it was found that the mean home value was $165,000 and the median home value was $125,000. Which of the following situations could explain the difference between the mean and median home values in the county?
-
Solution
The mean and median values of a data set are equal when there is a symmetrical distribution. For example, a normal distribution is symmetrical. If the mean and the median values are not equal, then the distribution is not symmetrical. Outliers are a small group of values that are significantly smaller or larger than the other values in the data. When there are outliers in the data, the mean will be pulled in their direction (either smaller or larger) while the median remains the same. The example in the question has a mean that is larger than the median, and so an appropriate conjecture is that large outliers are present in the data; that is, that there are a few homes that are valued much more than the rest.
Choice A is incorrect because a set of home values that are close to each other will have median and mean values that are also close to each other. Choice B is incorrect because outliers with small values will tend to make the mean lower than the median. Choice D is incorrect because a set of data where many homes are valued between $125,000 and $165,000 will likely have both a mean and a median between $125,000 and $165,000.
The atomic weight of an unknown element, in atomic mass units (amu), is approximately 20% less than that of calcium. The atomic weight of calcium is 40 amu. Which of the following best approximates the atomic weight, in amu, of the unknown element?
-
Solution
To find the atomic weight of an unknown element that is 20% less than the atomic weight of calcium, multiply the atomic weight, in amu, of calcium by (1 − 0.20): (40)(1 − 0.20) = (40)(0.8) = 32.
Choice A is incorrect. This value is 20% of the atomic weight of calcium, not an atomic weight 20% less than that atomic weight of calcium. Choice B is incorrect. This value is 20 amu less, not 20% less, than the atomic weight of calcium. Choice D is incorrect. This value is 20% more, not 20% less, than the atomic weight of calcium.
Results on the Bar Exam of Law School Graduates

The table above summarizes the results of 200 law school graduates who took the bar exam. If one of the surveyed graduates who passed the bar exam is chosen at random for an interview, what is the probability that the person chosen did not take the review course?
-
Solution
According to the table, there are 18 + 7 = 25 graduates who passed the bar exam, and 7 of them did not take the review course. Therefore, if one of the surveyed graduates who passed the bar exam is chosen at random, the probability that the person chosen did not take the review course is \(\frac{7}{25}\).
Choices A, C, and D are incorrect. Each of these choices represents a different probability from the conditional probability that the question asks for.Choice A represents the following probability. If one of the surveyed graduates who passed the bar exam is chosen at random, the probability that the person chosen did take the review course is \(\frac{18}{25}\). Choice C represents the following probability. If one of the surveyed graduates is chosen at random, the probability that the person chosen passed the bar exam is \(\frac{25}{200}\). Choice D represents the following probability. If one of the surveyed graduates is chosen at random, the probability that the person chosen passed the exam and took the review course is \(\frac{7}{200}\).
The distance traveled by Earth in one orbit around the Sun is about 580,000,000 miles. Earth makes one complete orbit around the Sun in one year. Of the following, which is closest to the average speed of Earth, in miles per hour, as it orbits the Sun?
-
Solution
The number of miles Earth travels in its one-year orbit of the Sun is 580,000,000. Because there are about 365 days per year, the number of miles Earth travels per day is \(\frac{580,000,000}{365}\) ≈ 1,589,041. There are 24 hours in one day, so Earth travels at \(\frac{1,589,041}{24}\) ≈ 66,210 miles per hour. Therefore, of the choices given, 66,000 miles per hour is closest to the average speed of Earth as it orbits the Sun.
Choices B, C, and D are incorrect and may result from calculation errors.

According to the line of best fit in the scatterplot above, which of the following best approximates the year in which the number of miles traveled by air passengers in Country X was estimated to be 550 billion?
-
Solution
According to the graph, the horizontal line that represents 550 billion miles traveled intersects the line of best fit at a point whose horizontal coordinate is between 2000 and 2005, and slightly closer to 2005 than to 2000. Therefore, of the choices given, 2003 best approximates the year in which the number of miles traveled by air passengers in Country X was estimated to be 550 billion.
Choice A is incorrect. According to the line of best fit, in 1997 the estimated number of miles traveled by air passengers in Country X was about 450 billion, not 550 billion. Choice B is incorrect. According to the line of best fit, in 2000 the estimated number of miles traveled by air passengers in Country X was about 500 billion, not 550 billion. Choice D is incorrect. According to the line of best fit, in 2008 the estimated number of miles traveled by air passengers in Country X was about 600 billion,not 550 billion.
