A cylindrical can containing pieces of fruit is filled to the top with syrup before being sealed. The base of the can has an area of 75 cm2, and the height of the can is 10 cm. If 110 cm3 of syrup is needed to fill the can to the top, which of the following is closest to the total volume of the pieces of fruit in the can?
-
Solution
The total volume of the cylindrical can is found by multiplying the area of the base of the can, 75 cm2, by the height of the can, 10 cm, which yields 750 cm3. If the syrup needed to fill the can has a volume of 110 cm3, then the remaining volume for the pieces of fruit is 750 – 110 = 640 cm3.
Choice A is incorrect because if the fruit had a volume of 7.5 cm3, there would be 750 – 7.5 = 742.5 cm3 of syrup needed to fill the can to the top. Choice B is incorrect because if the fruit had a volume of 185 cm3,there would be 750 – 185 = 565 cm3 of syrup needed to fill the can to the top. Choice D is incorrect because it is the total volume of the can,not just of the pieces of fruit.

A survey was given to residents of all 50 states asking if they had earned a bachelor’s degree or higher. The results from 7 of the states are given in the table above. The median percent of residents who earned a bachelor’s degree or higher for all 50 states was 26.95%. What is the difference between the median percent of residents who earned a bachelor’s degree or higher for these 7 states and the median for all 50 states?
-
Solution
The median of a set of numbers is the middle value of the set values when ordered from least to greatest. If the percents in the table are ordered from least to greatest, the middle value is 27.9%. The difference between 27.9% and 26.95% is 0.95%.
Choice A is incorrect and may be the result of calculation errors or not finding the median of the data in the table correctly. Choice C is incorrect and may be the result of finding the mean instead of the median. Choice D is incorrect and may be the result of using the middle value of the unordered list.

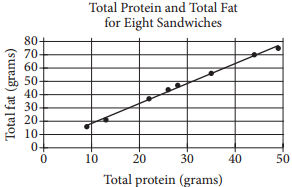
The scatterplot above shows the numbers of grams of both total protein and total fat for eight sandwiches on a restaurant menu. The line of best fit for the data is also shown. According to the line of best fit, which of the following is closest to the predicted increase in total fat, in grams, for every increase of 1 gram in total protein?
-
Solution
The predicted increase in total fat, in grams, for every increase of 1 gram in total protein is represented by the slope of the line of best fit. Any two points on the line can be used to calculate the slope of the line as the change in total fat over the change in total protein. For instance, it can be estimated that the points (20, 34) and (30, 48) are on the line of best fit, and the slope of the line that passes through them is \(\frac{48 − 34}{30 − 20}=\frac{14}{10}\), or 1.4. Of the choices given, 1.5 is the closest to the slope of the line of best fit.
Choices A, B, and D are incorrect and may be the result of incorrectly finding ordered pairs that lie on the line of best fit or of incorrectly calculating the slope.
refer to the following information.
Mosteller’s formula: A = \(\sqrt{\frac{hw}{60}}\)
Current’s formula: A = \(\frac{4-w}{30}\)
The formulas above are used in medicine to estimate the body surface area A, in square meters, of infants and children whose weight w ranges between 3 and 30 kilograms and whose height h is measured in centimeters.
If Mosteller’s and Current’s formulas give the same estimate for A, which of the following expressions is equivalent to \(\sqrt{hw}\)?
-
Solution
If Mosteller’s and Current’s formulas give the same estimate for A, then the right-hand sides of these two equations are equal; that is,\(\frac{\sqrt{hw}}{60}=\frac{4+w}{30}\). Multiplying each side of this equation \(\sqrt{hw}\) 60 to isolate the expression \(\sqrt{hw}\) gives \(\sqrt{hw}\) = 60 \(\left ( \frac{4+w}{30} \right )\) or \(\left ( \frac{4+w}{30} \right )\) = 2 (4 + w). Therefore, if Mosteller’s and Current’s formulas give the same estimate for A, then \(\sqrt{hw}\) is equivalent to 2(4 + w).
An alternate approach is to multiply the numerator and denominator of Current’s formula by 2, which gives \(\frac{2(4 + w)}{60}\). Since it is given that Mosteller’s and Current’s formulas give the same estimate for A,\(\frac{2(4+w)}{60}=\frac{\sqrt{hw}}{60}\). Therefore,\(\sqrt{hw}\) = 2(4 + w).
Choices A, B, and D are incorrect and may result from errors in the algebraic manipulation of the equations.
refer to the following information.
Mosteller’s formula: A = \(\sqrt{\frac{hw}{60}}\)
Current’s formula: A = \(\frac{4-w}{30}\)
The formulas above are used in medicine to estimate the body surface area A, in square meters, of infants and children whose weight w ranges between 3 and 30 kilograms and whose height h is measured in centimeters.
Based on Current’s formula, what is w in terms of A ?
-
Solution
Current’s formula is A = \(\frac{4+w}{30}\).Multiplying each side of the equation by 30 gives 30A = 4 + w. Subtracting 4 from each side of 30A = 4 + w gives w = 30A – 4.
Choices B, C, and D are incorrect and may result from errors in choosing and applying operations to isolate w as one side of the equation in Current’s formula.

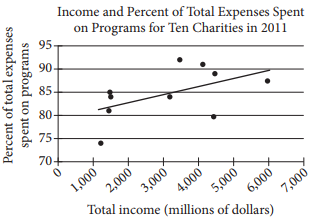
The scatterplot above shows data for ten charities along with the line of best fit. For the charity with the greatest percent of total expenses spent on programs, which of the following is closest to the difference of the actual percent and the percent predicted by the line of best fit?
-
Solution
The charity with the greatest percent of total expenses spent on programs is represented by the highest point on the scatterplot; this is the point that has a vertical coordinate slightly less than halfway between 90 and 95 and a horizontal coordinate slightly less than halfway between 3,000 and 4,000. Thus, the charity represented by this point has a total income of about $3,400 million and spends about 92% of its total expenses on programs. The percent predicted by the line of best fit is the vertical coordinate of the point on the line of best fit with horizontal coordinate $3,400 million; this vertical coordinate is very slightly more than 85. Thus, the line of best fit predicts that the charity with the greatest percent of total expenses spent on programs will spend slightly more than 85% on programs. Therefore, the difference between the actual percent (92%) and the prediction (slightly more than 85%) is slightly less than 7%.
Choice A is incorrect. There is no charity represented in the scatterplot for which the difference between the actual percent of total expenses spent on programs and the percent predicted by the line of best fit is as much as 10%. Choices C and D are incorrect. These choices may result from misidentifying in the scatterplot the point that represents the charity with the greatest percent of total expenses spent on programs.
y = 19.99 + 1.50x
The equation above models the total cost y, in dollars, that a company charges a customer to rent a truck for one day and drive the truck x miles.The total cost consists of a flat fee plus a charge per mile riven. When the equation is graphed in the xy-plane, what does the y-intercept of the graph represent in terms of the model?
-
Solution
The y-intercept of the graph of y = 19.99 + 1.50x in the xy-plane is the point on the graph with an x-coordinate equal to 0. In the model represented by the equation, the x-coordinate represents the number of miles a rental truck is driven during a one-day rental, and so the y-intercept represents the charge, in dollars, for the rental when the truck is driven 0 miles; that is, the y-intercept represents the cost, in dollars, of the flat fee. Since the y-intercept of the graph of y = 19.99 + 1.50x is (0, 19.99), the y-intercept represents a flat fee of $19.99 in terms of the model.
Choice B is incorrect. The slope of the graph of y = 19.99 + 1.50x in the xy-plane, not the y-intercept, represents a driving charge per mile of $1.50 in terms of the model. Choice C is incorrect. Since the coefficient of x in the equation is 1.50, the charge per mile for driving the rental truck is $1.50, not $19.99. Choice D is incorrect. The sum of 19.99 and 1.50, which is 21.49, represents the cost, in dollars, for renting the truck for one day and driving the truck 1 mile; however, the total daily charges for renting the truck does not need to be $21.49.
If a − b = 12 and b⁄2 = 10, what is the value of a + b ?
-
Solution
If b⁄2 = 10, then multiplying each side of this equation by 2 gives b = 20. Substituting 20 for b in the equation a − b = 12 gives a − 20 = 12. Adding 20 to each side of this equation gives a = 32. Since a = 32 and b = 20, it follows that the value of a + b is 32 + 20, or 52.
Choice A is incorrect. If the value of a + b were less than the value of a − b, it would follow that b is negative. But if b⁄2 = 10, then b must be positive. This contradiction shows that the value of a + b cannot be 2. Choice B is incorrect. If the value of a + b were equal to the value of a – b, then it would follow that b = 0. However, b cannot equal zero because it is given that b⁄2 = 10. Choice C is incorrect. This is the value of a, but the question asks for the value of a + b.
If 50 one-cent coins were stacked on top of each other in a column, the column would be approximately 37⁄8 inches tall. At this rate, which of the following is closest to the number of one-cent coins it would take to make an 8-inch-tall column?
-
Solution
A column of 50 stacked one-cent coins is about 37⁄8 inches tall, which is slightly less than 4 inches tall. Therefore a column of stacked one-cent coins that is 4 inches tall would contain slightly more than 50 one-cent coins. It can then be reasoned that because 8 inches is twice 4 inches, a column of stacked one-cent coins that is 8 inches tall would contain slightly more than twice as many coins; that is, slightly more than 100 one-cent coins. An alternate approach is to set up a proportion comparing the column height to the number of one-cent coins, or \(\frac{3\frac{7}{8}inches}{50\, coins}=\frac{8\, inches}{x\, coins}\), where x is the number of coins in an 8-inch-tall column. Multiplying each side of the proportion by 50x gives 37⁄8 x = 400. Solving for x gives x =\(\frac{400 \times 8}{31}\),which is approximately 103. Therefore, of the given choices, 100 is closest to the number of one-cent coins it would take to build an 8-inch-tall column.
Choice A is incorrect. A column of 75 stacked one-cent coins would be slightly less than 6 inches tall. Choice C is incorrect. A column of 200 stacked one-cent coins would be more than 15 inches tall. Choice D is incorrect. A column of 390 stacked one-cent coins would be over 30 inches tall.

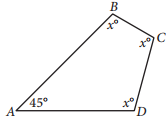
In the figure above, what is the value of x ?
-
Solution
The figure is a quadrilateral, so the sum of the measures of its interior angles is 360°. The value of x can be found by using the equation 45 + 3x = 360. Subtracting 45 from both sides of the equation results in 3x = 315, and dividing both sides of the resulting equation by 3 yields x = 105. Therefore, the value of x in the figure is 105.
Choice A is incorrect. If the value of x were 45, the sum of the measures of the angles in the figure would be 45 + 3(45), or 180°, but the sum of the measures of the angles in a quadrilateral is 360°. Choice B is incorrect. If the value of x were 90, the sum of the measures of the angles in the figure would be 45 + 3(90), or 315°, but the sum of the measures of the angles in a quadrilateral is 360°. Choice C is incorrect. If the value of x were 100, the sum of the measures of the angles in the figure would be 45 + 3(100), or 345°, but the sum of the measures of the angles in a quadrilateral is 360°.