The mean score of 8 players in a basketball game was 14.5 points. If the highest individual score is removed, the mean score of the remaining 7 players becomes 12 points. What was the highest score?
-
Solution
If the mean score of 8 players is 14.5, then the total of all 8 scores is 14.5 × 8 = 116. If the mean of 7 scores is 12, then the total of all 7 scores is 12 × 7 = 84. Since the set of 7 scores was made by removing the highest score of the set of 8 scores, then the difference between the total of all 8 scores and the total of all 7 scores is equal to the removed score: 116 − 84 = 32.
Choice A is incorrect because if 20 is removed from the group of 8 scores, then the mean score of the remaining 7 players is \(\frac{(14.5\cdot 8)-20}{7}\approx 13.71\), not 12. Choice B is incorrect because if 24 is removed from the group of 8 scores, then the mean score of the remaining 7 players is \(\frac{(14.5\cdot 8)-24}{7}\approx 13.14\) , not 12. Choice D is incorrect because if 36 is removed from the group of 8 scores, then the mean score of the remaining 7 players is \(\frac{(14.5\cdot 8)-24}{36}\approx 11.43\), not 12.
The surface area of a cube is 6(a⁄4)2, where a is a positive constant. Which of the following gives the perimeter of one face of the cube?
-
Solution

A psychologist set up an experiment to study the tendency of a person to select the first item when presented with a series of items. In the experiment, 300 people were presented with a set of five pictures arranged in random order. Each person was asked to choose the most appealing picture. Of the first 150 participants, 36 chose the first picture in the set. Among the remaining 150 participants, p people chose the first picture in the set. If more than 20% of all participants chose the first picture in the set, which of the following inequalities best describes the possible values of p ?
-
Solution
Of the first 150 participants, 36 chose the first picture in the set, and of the 150 remaining participants, p chose the first picture in the set. Hence, the proportion of the participants who chose the first picture in the set is \(\frac{36+p}{300}\). Since more than 20% of all the participants chose the first picture, it follows that \(\frac{36+p}{300}\) > 0.20. This inequality can be rewritten as p + 36 > 0.20(300). Since p is a number of people among the remaining 150 participants, p ≤ 150.
Choices A, B, and C are incorrect and may be the result of some incorrect interpretations of the given information or of computational errors.
refer to the following information.

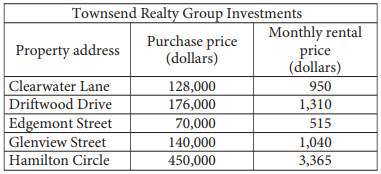
The Townsend Realty Group invested in the five different properties listed in the table above. The table shows the amount, in dollars, the company paid for each property and the corresponding monthly rental price, in dollars, the company charges for the property at each of the five locations.
Townsend Realty purchased the Glenview Street property and received a 40% discount off the original price along with an additional 20% off the discounted price for purchasing the property in cash. Which of the following best approximates the original price, in dollars, of the Glenview Street property?
-
Solution
Let x be the original price, in dollars, of the Glenview Street property. After the 40% discount, the price of the property became 0.6x dollars, and after the additional 20% off the discounted price, the price of the property became 0.8(0.6x). Thus, in terms of the original price of the property, x, the purchase price of the property is 0.48x. It follows that 0.48x = 140,000. Solving this equation for x gives x = 291,666.\(\bar{6}\). Therefore, of the given choices,$291,700 best approximates the original price of the Glenview Street property.
Choice A is incorrect because it is the result of dividing the purchase price of the property by 0.4, as though the purchase price were 40% of the original price. Choice C is incorrect because it is the closest to dividing the purchase price of the property by 0.6, as though the purchase price were 60% of the original price. Choice D is incorrect because it is the result of dividing the purchase price of the property by 0.8, as though the purchase price were 80% of the original price.
refer to the following information.

The Townsend Realty Group invested in the five different properties listed in the table above. The table shows the amount, in dollars, the company paid for each property and the corresponding monthly rental price, in dollars, the company charges for the property at each of the five locations.
The relationship between the monthly rental price r, in dollars, and the property’s purchase price p, in thousands of dollars, can be represented by a linear function. Which of the following functions represents the relationship?
-
Solution
The linear function that represents the relationship will be in the form r(p) = ap + b, where a and b are constants and r(p) is the monthly rental price, in dollars, of a proprty that was purchased with p thousands of dollars. According to the table, (70, 515) and (450, 3,365) are ordered pairs that should satisfy the function, which leads to the system of equations below.
\(\left\{\begin{matrix} 70a\, +\, b\, = 515 & \\ 450a\, +\, b\, = 3,365 & \end{matrix}\right.\)
Subtracting side by side the first equation from the second eliminates b and gives 380a = 2,850; solving for a gives a=\(\frac{2,850}{380}\)=7.5. Substituting 7.5 for a in the first equation of the system gives 525 + b = 515; solving for b gives b = −10. Therefore, the linear function that represents the relationship is r(p) = 7.5p − 10.
Choices A, B, and C are incorrect because the coefficient of p, or the rate at which the rental price, in dollars, increases for every thousand-dollar increase of the purchase price is different from what is suggested by these choices. For example, the Glenview Street property was purchased for $140,000, but the rental price that each of the functions in these choices provides is significantly off from the rental price given in the table, $1,040.
In State X, Mr. Camp’s eighth-grade class consisting of 26 students was surveyed and 34.6 percent of the students reported that they had at least two siblings. The average eighth‑grade class size in the state is 26. If the students in Mr. Camp’s class are representative of students in the state’s eighth-grade classes and there are 1,800 eighth-grade classes in the state, which of the following best estimates the number of eighth‑grade students in the state who have fewer than two siblings?
-
Solution
It is given that 34.6% of 26 students in Mr. Camp’s class reported that they had at least two siblings. Since 34.6% of 26 is 8.996, there must have been 9 students in the class who reported having at least two siblings and 17 students who reported that they had fewer than two siblings. It is also given that the average eighth-grade class size in the state is 26 and that Mr. Camp’s class is representative of all eighth-grade classes in the state. This means that in each eighth-grade class in the state there are about 17 students who have fewer than two siblings. Therefore, the best estimate of the number of eighth-grade students in the state who have fewer than two siblings is 17 × (number of eighth-grade classes in the state), or 17 × 1,800 = 30,600.
Choice A is incorrect because 16,200 is the best estimate for the number of eighth-grade students in the state who have at least, not fewer than, two siblings. Choice B is incorrect because 23,400 is half of the estimated total number of eighth-grade students in the state; however, since the students in Mr. Camp’s class are representative of students in the eighthgrade classes in the state and more than half of the students in Mr. Camp’s class have fewer than two siblings, more than half of the students in each eighth-grade class in the state have fewer than two siblings, too. Choice D is incorrect because 46,800 is the estimated total number of eighth-grade students in the state.
In the equation above, if a is negative and b is positive, which of the following must be true?
-
Solution
The equation can be rewritten as 1 - b⁄a = c, or equivalently 1 - c = b⁄a.Since a < 0 and b > 0, it follows;that b⁄a < 0, and so 1 − c < 0, or equivalently c > 1.
Choice B is incorrect. If c = 1, then a − b = a, or b = 0. But it is given that b > 0, so c = 1 cannot be true. Choice C is incorrect. If c = −1, then a − b = −a, or 2a = b. But this equation contradicts the premise that a < 0 and b > 0, so c = −1 cannot be true. Choice D is incorrect. For example, if c = −2, then a − b = −2a, or 3a = b. But this contradicts the fact that a and b have opposite signs, so c < −1 cannot be true.

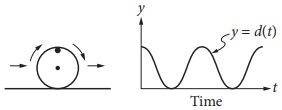
The figure on the left above shows a wheel with a mark on its rim. The wheel is rolling on the ground at a constant rate along a level straight path from a starting point to an ending point. The graph of y = d(t) on the right could represent which of the following as a function of time from when the wheel began to roll?
-
Solution
The graph on the right shows the change in distance from the ground of the mark on the rim over time. The y-intercept of the graph corresponds to the mark’s position at the start of the motion (t = 0); at this moment, the mark is at its highest point from the ground. As the wheel rolls, the mark approaches the ground, its distance from the ground decreasing until it reaches 0—the point where it touches the ground. After that, the mark moves up and away from the ground, its distance from the ground increasing until it reaches its maximum height from the ground. This is the moment when the wheel has completed a full rotation. The remaining part of the graph shows the distance of the mark from the ground during the second rotation of the wheel. Therefore, of the given choices, only choice D is in agreement with the given information.
Choice A is incorrect because the speed at which the wheel is rolling does not change over time, meaning the graph representing the speed would be a horizontal line. Choice B is incorrect because the distance of the wheel from its starting point to its ending point increases continuously; the graph shows a quantity that changes periodically over time, alternately decreasing and increasing. Choice C is incorrect because the distance of the mark from the center of the wheel is constant and equals the radius of the wheel. The graph representing this distance would be a horizontal line, not the curved line of the graph shown.

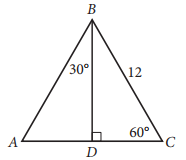
In △ABC above, what is the length of \(\overline{AD}\) ?
-
Solution
Triangles ADB and CDB are congruent to each other because they are both 30°-60°-90° triangles and share the side \(\overline{BD}\). In triangle ADB, side \(\overline{AD}\) is opposite to the angle 30°; therefore, the length of \(\overline{AD}\) is half the length of hypotenuse \(\overline{AB}\). Since the triangles are congruent, AB = BC = 12. So the length of \(\overline{AD}\) is \(\frac{12}{2}=6\).
Choice A is incorrect. If the length of \(\overline{AD}\) were 4, then the length of \(\overline{AB}\) would be 8. However, this is incorrect because \(\overline{AB}\) is congruent to \(\overline{AB}\) , which has a length of 12. Choices C and D are also incorrect. Following the same procedures as used to test choice A gives \(\overline{AB}\) a length of 12√2 for choice C and 12√3 for choice D. However, these results cannot be true because \(\overline{AB}\) is congruent to \(\overline{BC}\), which has a length of 12.
refer to the following information.

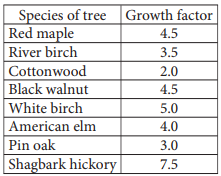
One method of calculating the approximate age, in years, of a tree of a particular species is to multiply the diameter of the tree, in inches, by a constant called the growth factor for that species. The table above gives the growth factors for eight species of trees.
If a white birch tree and a pin oak tree each now have a diameter of 1 foot, which of the following will be closest to the difference, in inches, of their diameters 10 years from now? (1 foot = 12 inches)
-
Solution
According to the given information, multiplying a tree species’ growth factor by the tree’s diameter is a method to approximate the age of the tree. A white birch with a diameter of 12 inches (or 1 foot) has a given growth factor of 5 and is approximately 60 years old. A pin oak with a diameter of 12 inches (or 1 foot) has a given growth factor of 3 and is approximately 36 years old. The diameters of the two trees 10 years from now can be found by dividing each tree’s age in 10 years, 70 years, and 46 years, by its respective growth factor. This yields 14 inches and 151⁄3 inches. The difference between 151⁄3 and 14 is 11⁄3, or approximately 1.3 inches.
Choices A, B, and D are incorrect and a result of incorrectly calculating the diameters of the two trees in 10 years.
