If 3 −2 ≥ 1 p , what is the least possible value of 3 +2 p ?
-
Solution
Adding 4 to each side of the inequality 3p − 2 ≥ 1 yields the inequality 3p + 2 ≥ 5. Therefore, the least possible value of 3p + 2 is 5.
Choice B is incorrect because it gives the least possible value of 3p, not of 3p + 2. Choice C is incorrect. If the least possible value of 3p + 2 were 2, then it would follow that 3p + 2 ≥ 2. Subtracting 4 from each side of this inequality would yield 3p − 2 ≥ −2. This contradicts the given inequality, 3p − 2 ≥ 1. Therefore, the least possible value of 3p + 2 cannot be 2. Choice D is incorrect because it gives the least possible value of p, not of 3p +2
Jim has identical drinking glasses each in the shape of a right circular cylinder with internal diameter of 3 inches. He pours milk from a gallon jug into each glass until it is full. If the height of milk in each glass is about 6 inches, what is the largest number of full milk glasses that he can pour from one gallon of milk? (Note: There are 231 cubic inches in 1 gallon.)
-
Solution
The volume V of a right circular cylinder is given by the formula V = πr2h, where r is the base radius of the cylinder and h is the height of the cylinder. Since each glass has an internal diameter of 3 inches, each glass has a base radius of 3⁄2 inches. Since the height of the milk in each glass is 6 inches, the volume of milk in each glass is V = π (3⁄2)3⁄2(6) ≈ 42.41 cubic inches. The total is equal to \(\frac{number\, of\, glasses\, Jim\, can\, pour\, from\, 1\, gallon}{number\, of\, cubic\, inches\, in\, 1\, glass}=\frac{231}{42.41}\) 42.41, which is approximately 5.45 glasses. Since the question asks for the largest number of full glasses Jim can pour, the number of glasses needs to be rounded down to 5.
Choices A, B, and D are incorrect and may be the result of conceptual errors or calculation errors. For example, choice D is incorrect because even though Jim can pour more than 5 full glasses, he will not have enough milk to pour a full 6th glass.
If the relationship between the total cost, y, of buying the materials and renting the tools at Store C and the number of days, x, for which the tools are rented is graphed in the xy-plane, what does the slope of the line represent?
-
Solution
The total cost, y, of buying the materials and renting the tools in terms of the number of days, x, is given as y = M + (W + K)x. If this relationship is graphed in the xy-plane, the slope of the graph is equal to W + K, which is the daily rental cost of the wheelbarrow plus the daily rental cost of the concrete mixer, that is, the total daily rental costs of the tools. Choice A is incorrect because the total cost of the project is y.
Choice B is incorrect because the total cost of the materials is M, which is the y-intercept of the graph of y = M + (W + K)x. Choice C is incorrect because the total daily cost of the project is the total cost of the project divided by the total number of days the project took and, since materials cost more than 0 dollars, this is not the same as the total daily rental costs.
refer to the following information.
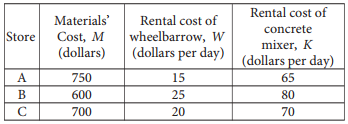
Mr. Martinson is building a concrete patio in his backyard and deciding where to buy the materials and rent the tools needed for the project. The table below shows the materials’ cost and daily rental costs for three different stores.

The total cost, y, for buying the materials and renting the tools in terms of the number of days, x, is given by y = M + (M + K) x.
For what number of days, x, will the total cost of buying the materials and renting the tools from Store B be less than or equal to the total cost of buying the materials and renting the tools from Store A ?
-
Solution
The total cost y, in dollars, of buying the materials and renting the tools for x days from Store A and Store B is found by substituting the respective values for these stores from the table into the given equation, y = M + (W + K)x, as shown below.
Store A: y = 750 + (15 + 65)x = 750 + 80x
Store B: y = 600 + (25 + 80)x = 600 + 105x
Thus, the number of days, x, for which the total cost of buying the materials and renting the tools from Store B is less than or equal to the total cost of buying the materials and renting the tools from Store A can be found by solving the inequality 600 + 105x ≤ 750 + 70x. Subtracting 80x and 600 from each side of 600 + 105x ≤ 750 + 70x and combining like terms yields 25x ≤ 150. Dividing each side of 25x ≤ 150 by 25 yields x ≤ 6.
Choice B is incorrect. The inequality x ≥ 6 is the number of days for which the total cost of buying the materials and renting the tools from Store B is greater than or equal to the total cost of buying the materials and renting the tools from Store A. Choices C and D are incorrect and may be the result of an error in setting up or simplifying the inequality.
Which of the following scatterplots shows a relationship that is appropriately modeled with the equation y = axb, where a is positive and b is negative?
-
Solution
The graph of y = axb, where a is positive and b is negative, has a positive y-intercept and rapidly decreases (in particular, decreases at a faster rate than a linear function) toward the x-axis as x increases. Of the scatterplots shown, only the one in choice B would be appropriately modeled by such a function.
Choice A is incorrect, as this scatterplot is appropriately modeled by a linear
function. Choice C is incorrect, as this scatterplot is appropriately modeled by an increasing function. Choice D is incorrect, as this scatterplot shows no clear relationship between x and y.
1,000\(\left ( 1+\frac{r}{1,200} \right )^{12}\)
The expression above gives the amount of money, in dollars, generated in a year by a $1,000 deposit in a bank account that pays an annual interest rate of r %, compounded monthly. Which of the following expressions shows how much additional money is generated at an interest rate of 5% than at an interest rate of 3% ?
-
Solution
According to the given formula, the amount of money generated for a year at 5% interest, compounded monthly, is 1,000\(\left ( 1+\frac{5}{1,200} \right )^{12}\), whereas the amount of money generated at 3% interest, compounded monthly, is 1,000\(\left ( 1+\frac{3}{1,200} \right )^{12}\) . Therefore, the difference between these two amounts,\(1,000\left ( 1+\frac{5}{1,200} \right )^{12}-1,000\left ( 1+\frac{3}{1,200} \right )^{12}\), shows how much additional money is generated at an interest rate of 5% than at an interest rate of 3%.
Choices A, B, and C are incorrect and may be the result of misinterpreting the given formula. For example, the expression in choice C gives how many times as much money, not how much additional money, is generated at an interest rate of 5% than at an interest rate of 3%.
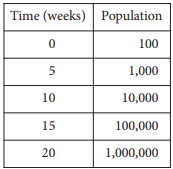
The population of mosquitoes in a swamp is estimated over the course of twenty weeks, as shown in the table.

Which of the following best describes the relationship between time and the estimated population of mosquitoes during the twenty weeks?
-
Solution
The mosquito population starts at 100 in week 0 and then is multiplied by a factor of 10 every 5 weeks. Thus, if P(t) is the mosquito population after t weeks, then based on the table, P(t) = 100 (10)t⁄5, which indicates an exponential growth relationship.
Choices A, B, and D are incorrect and may be the result of an incorrect interpretation of the relationship or errors in modeling the relationship.
In the xy-plane, the graph of function f has x-intercepts at −3, −1, and 1. Which of the following could define f ?
-
Solution
All of the given choices are polynomials. If the graph of a polynomial function f in the xy-plane has an x-intercept at b, then (x − b)must be a factor of f(x). Since −3, −1, and 1 are each x-intercepts of the graph of f, it follows that (x + 3), (x +1), and (x − 1) must each be a factor of f(x). The factored polynomial function in choice C is the only polynomial given with these 3 factors.
Choices A, B, and D are incorrect because they do not contain all three factors that must exist if the graph of the polynomial function f has x-intercepts at −3, −1, and 1.
refer to the following information.

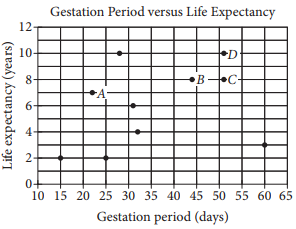
A curator at a wildlife society created the scatterplot above to examine the relationship between the gestation period and life expectancy of 10 species of animals.
Of the labeled points, which represents the animal for which the ratio of life expectancy to gestation period is greatest?
-
Solution
The ratio of life expectancy to gestation period for the animal represented by point A is approximately \(\frac{7\, years}{23\, days}\), or about 0.3 years/day, which is greater than the ratio for the animals represented by the other labeled points (the ratios for points B, C, and D, in units of years of life expectancy per day of gestation, are approximately \(\frac{8}{44}\), \(\frac{8}{51}\), and \(\frac{10}{51}\) respectively, each of which is less than 0.2 years/day).
Choices B, C, and D are incorrect and may be the result of errors in calculating the ratio or in reading the graph.
refer to the following information.

A curator at a wildlife society created the scatterplot above to examine the relationship between the gestation period and life expectancy of 10 species of animals.
What is the life expectancy, in years, of the animal that has the longest gestation period?
-
Solution
According to the graph, the animal with the longest gestation period (60 days) has a life expectancy of 3 years.
Choices B, C, and D are incorrect. All the animals that have a life expectancy of 4, 8, or 10 years have a gestation period that is shorter than 60 days, which is the longest gestation period.